Good Morning,
This monthly focus edition is about fundamental risk measures in the financial industry: the Value at Risk (VaR) and Conditional Value at Risk (CVar). The VaR is a popular measure since it is easy to understand and explains the properties of the risk being taken with a single number. The CVaR, also called Tail Var and Expected Shortfall is considered as an even more conservative and coherent risk measure Artzner et al (1998).
With the recent unpredictable market movements, an accurate calculation of the VaR, CVar, Greeks and stress tests for derivative products and portfolios have become crucial for financial institutions. LexiFi’s solution delivers risk management tools that are sophisticated and scalable, yet factually fast and user-friendly!

The crystal ball
Whether it is for regulatory requirements, internal reporting, investment rules, compliance or quantitative portfolio hedging and optimization: the VaR and CVaR are predominant tools with a large implementation scope!
The idea behind the Value at Risk feature in LexiFi, is to provide you with a tool that is both easy to use and highly customizable. You may opt for a “one-click” process to calculate the VaR or:
- select the pricing model and related inputs
- change VaR calculation parameters
- chose between Historical and Monte Carlo methodologies
LexiFi allows to compute the VaR for either an individual contract or at the portfolio level.

What makes LexiFi’s VaR tool special?
The power of this tool comes from identifying and responding to users’ needs: speed, accessibility and robustness:
1- Speed: among the most important developments we can cite the “Fast VaR” mode: a mode that drastically accelerates VaR computations through a smart breakdown of scenarios pricing. We also optimize calculation speed through sharing scenario calculations among the VaR’s different computations. Finally, we also optimize VaR computation by evaluating multiple scenarios in the same run.
2- Accessibility: users automate the production of documents and reporting that seamlessly embed VaR, CVaR and stress tests
3- Continuous research: we closely monitor financial institutions needs and academic research innovation in order to adopt the best practices within the tool, both at the pricing infrastructure and the user interface levels. A concrete example is the filtered historical simulations scenario parameter for the historical VaR computation.

Historical VaR and filtering
The historical method consists in calculating the VaR directly from past returns. No assumptions are made about the distribution of historical data. This method is widely used thanks to its simplicity and transparency.
When using a wide time frame, one may question the relevance of old data. Users can mitigate this issue conforming historical returns: filtering returns to show current information about security risk using the Volatility Filtered Historical Simulation approach. This allows to adapt the scenarios used to compute the VaR so that they are coherent with the current volatility. Please get in touch if you would like to know more about the methodology used to scale the volatility.

Monte Carlo VaR
This statistical method consists in estimating a joint law of underlying risk factors by fitting a Time Series model to the joint available historical data of these factors. Multiple scenarios are then drawn by the model.
This approach often allows to decrease the statistical error of the loss quantile estimation. It can also be used when not enough data is available to run a historical VaR.
-
What about the results?
It is possible to save the outcome of the analysis (which includes detailed information about all the scenarios) as a pricing result attached to the contract, which can later be inspected again in the Pricing page.
-
VaR tab gives a summary of the VaR analysis: the VaR itself as an absolute amount or relative to the current price; and the same information for the Tail VaR, a refinement of the standard VaR, which accounts for the severity of failure and not only the chance of failure.
-
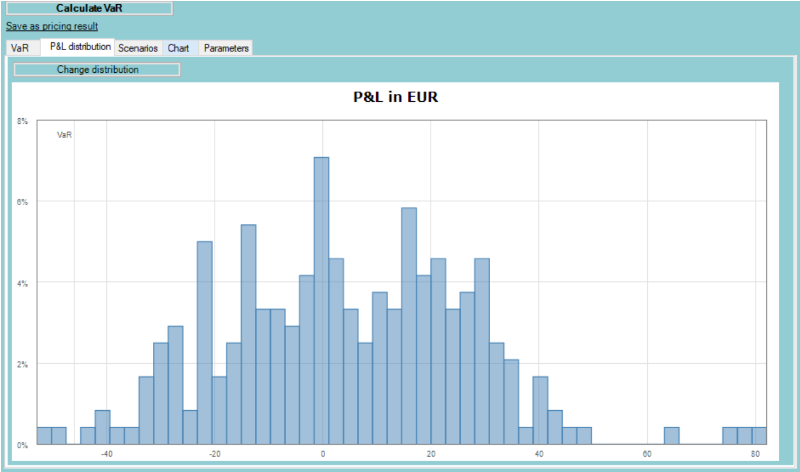
P&L distribution: a tab that displays a chart of profit and loss distribution for all considered scenarios. The chart also shows the VaR threshold.
-
Scenarios: this tab shows all the details about the scenarios used to compute the VaR. The date of the historical data used to define the scenario, the changes in the asset spots and volatility, and the resulting change in contract price.
-
A chart displaying the PnL vs the shock factors as well as a summary of the VaR calculation parameters.