Good Morning,
What would be your P&L in one year if all your product underlying levels increase or decrease by 10%?
Whether it is for internal needs, regulatory duties, or even client reports: running scenarios on future dates and studying the corresponding evolutions of prices and risk metrics is a precious feature!
LexiFi quants have recently extended our Risk Scenario tool by adding a time machine.
Welcome to the Future

The Forward Risk Scenario tool allows running a simulation at any date between today and product maturity date. Users specify a set of scenarios at future dates for the needed valuation.
Ever wondered when running future scenarios if results are realistic? If corresponding market data shocks are coherent? And if lifecycle events are correctly considered? With LexiFi Apropos forward scenario, you can be certain that:
- Simulation tools are designed to create custom market environments and combine shocks to create bespoke market scenarios
- Market data is shocked coherently throughout its trajectory
- Product lifecycle events (barriers, coupons, Autocall, etc.) are computed automatically and reported
Are you telling me you built a time machine?
 The tool computes product prices on future dates, given the applied scenario and allows to project market data in the future. The function applies lifecycle events on the contract and provides:
- The intermediate prices and cash-flows with corresponding market data
- Greeks, VaR, and other risk metrics users wish to include Using LexiFi Apropos’ document generator, all figures computed by the function can then be nicely presented in documents and reports, possibly combined with other analytics from the application.
With LexiFi’s Risk Scenario tool users can define, store, combine and reuse fully customizable market scenarios tailored to their needs or regulatory requirements. See our Risk Scenarios Monthly Focus for more details.
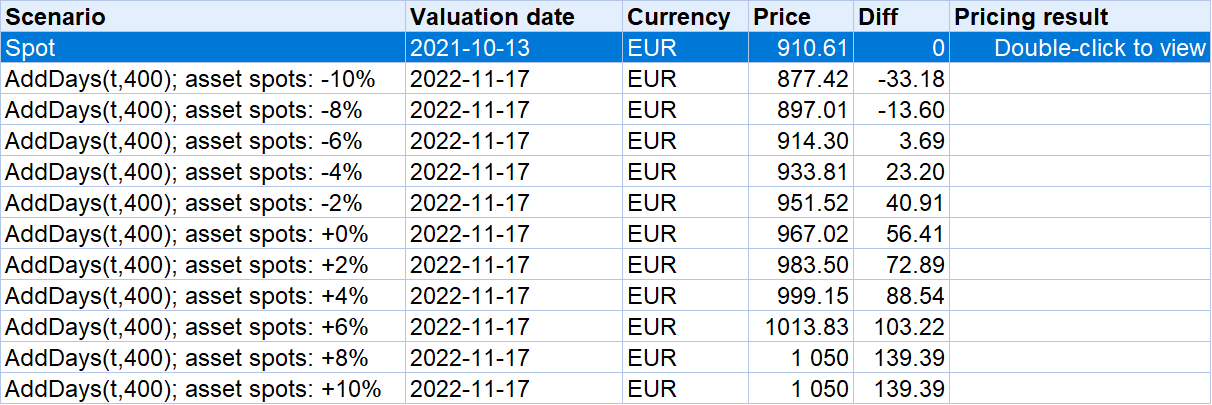
Example 1: Forward Risk Scenario analysis
What would be the product PNL in 1 year if underlying spot prices go up or down by 2, 4, 6, 8, or 10 percent from today’s spot? The product is an Autocall on Eurostoxx 50, Nikkei with coupon 5%: Autocall level = coupon level = 100%, with memory effect.
Example 2: Smart Interpolation and Risk Metrics
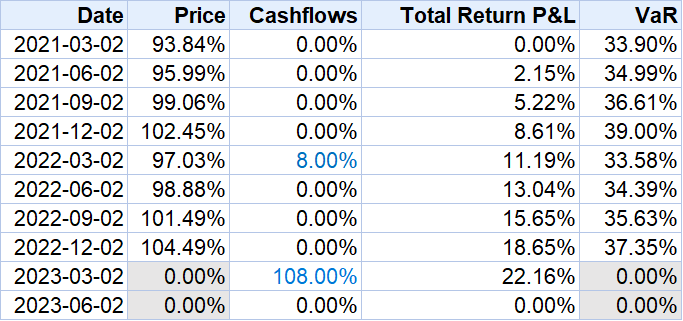
Suppose underlying asset spots increase by 2% in 2023-06-02 compared to 2021-03-02. We report results on a quarterly frequency. The product is an Autocall on Eurostoxx 50, Nikkei, and S&P500, with annual coupon payment distribution of 8%: Autocall Barrier 100%, coupon barrier 80%, capital protection barrier 60%.
Note: For this example, we chose to compute the VaR. Users may compute and report other metrics such as the Greeks.
We report the price and intermediate cash flows arising from lifecycle events such as the Autocall at 2023-03-02. The interpolation of intermediate fixings between today and the final date is computed such that each underlying makes +2% compared to today.
The PNL is calculated as follows:
t: observation date
PNL(t) = price(t) - price(0) + sum(cashflow(i)) ; i from 0 to t