Calibration associated to a given pricing operation involves essentially finding the parameters that best fit available market data given the pricing model to be used.
In the LexiFi Apropos solution, users access a long list of market and proprietary pricing models (the list of supported pricing models can be found here), as well as consistent, high-quality financial market data. Each pricing model has an associated fully documented calibration methodology. LexiFi’s quants provide upon request documentation detailing all model inputs, market data, model choice, calibration assumptions, calendars and more.
Models are automatically pre-calibrated, but always allow for user custom calibration when needed. Users have access to model calibration pages where they can edit both model and calibration parameters as shown in Figure 1 or run calibrations in one click and inspect results in depth.
An automatic cache allows saving and sharing calibration results across multiple pricing jobs as illustrated in Figure 2 with the saved results tab. Calibration results are displayed both in tables and charts, for easy but in-depth analysis.
Dedicated calibration inspectors are available for all models and allow, for instance, to:
- Inspect and verify resulting parameters and volatility surfaces
- Compare calibrated model numerical prices with market prices
- Explore through tracing and charting of surface data slices
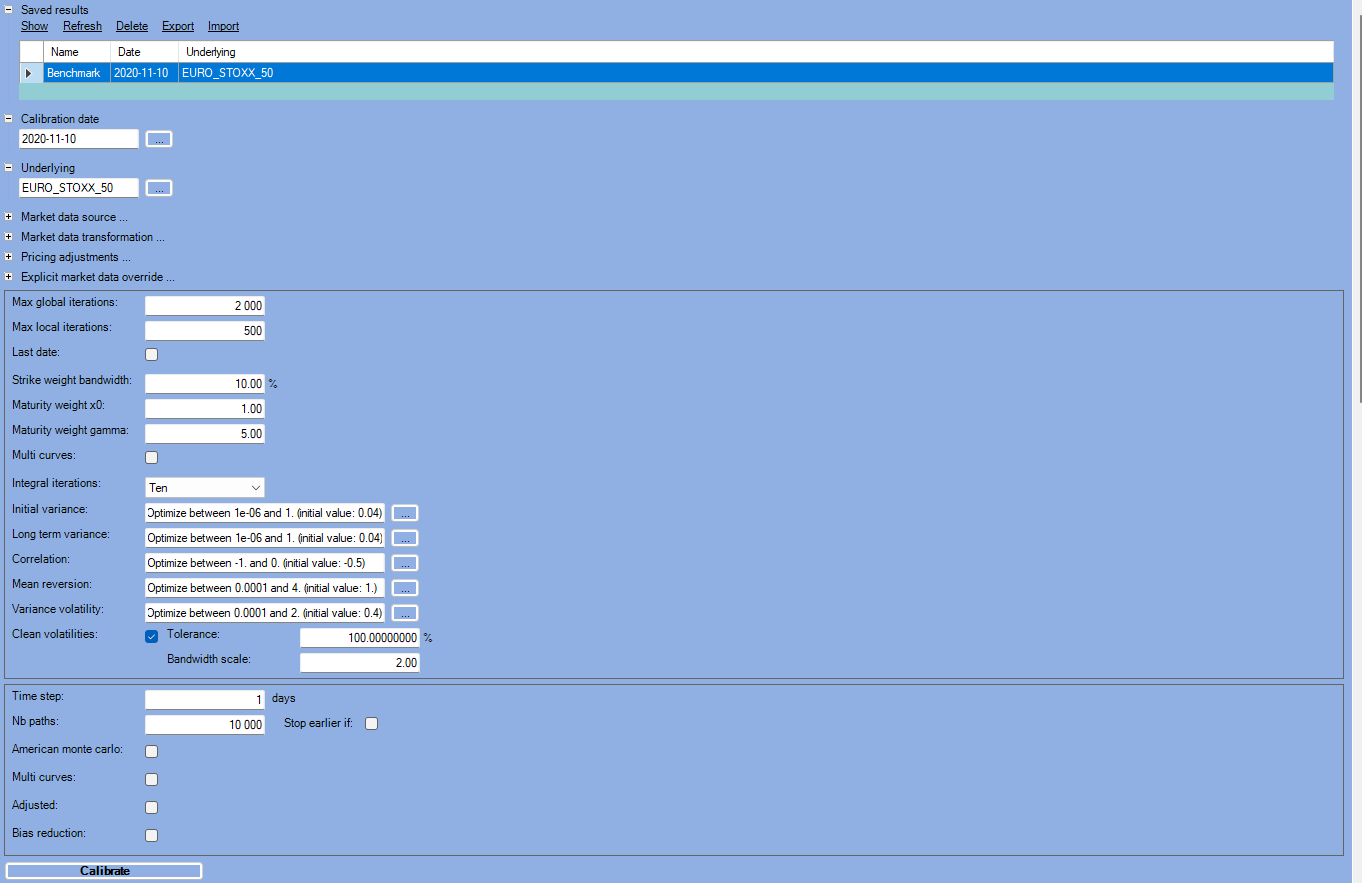 Figure 1: An example of the calibration page for the Heston model, where parameters are automatically set, but can also be customized by the user.
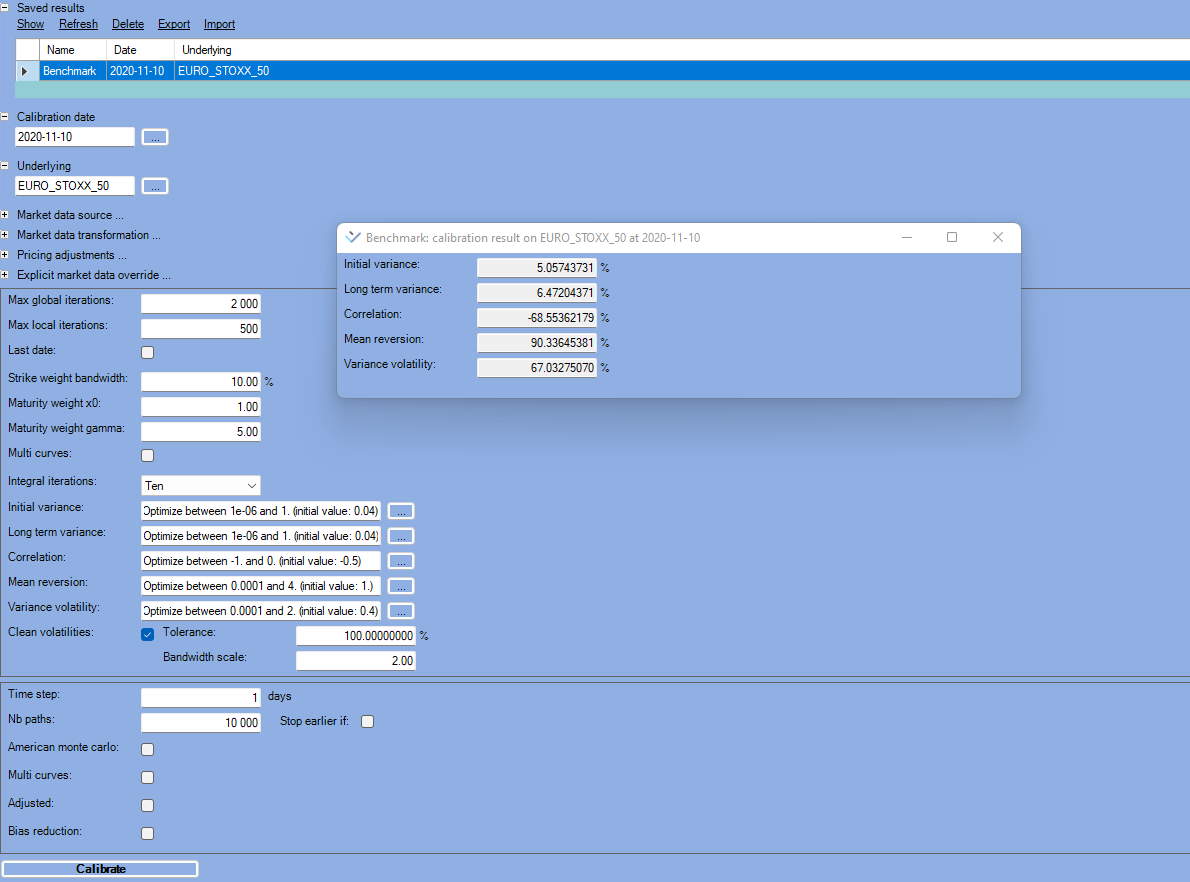 Figure 2: Saved Heston model calibration results: shows saved calibration results under the name “Benchmark” using Heston as the model to calibrate EUROSTOXX 50 Index market data.
The local Volatility model calibration example
We have selected the Local Volatility model, as it is widely used by our clients, to show the customization and result discovery possibilities that calibration pages offer to users. We use the EUROSTOXX 50 Index. Figure 3 below shows that users can customize data and parameters as follows:
- Edit the market data transformation methodology
- Apply pricing adjustments
- Explicitly override the market data used for the pricing
- Change Local Volatility calibration parameters:
- maturity and strike ranges
- the regular grid definition (maturity step, strike step …)
- smoothing parameters
- selecting Multiple curves mode
- including curves from FX
- clean volatilities tolerance and bandwidth scale
- Change Monte Carlo parameters
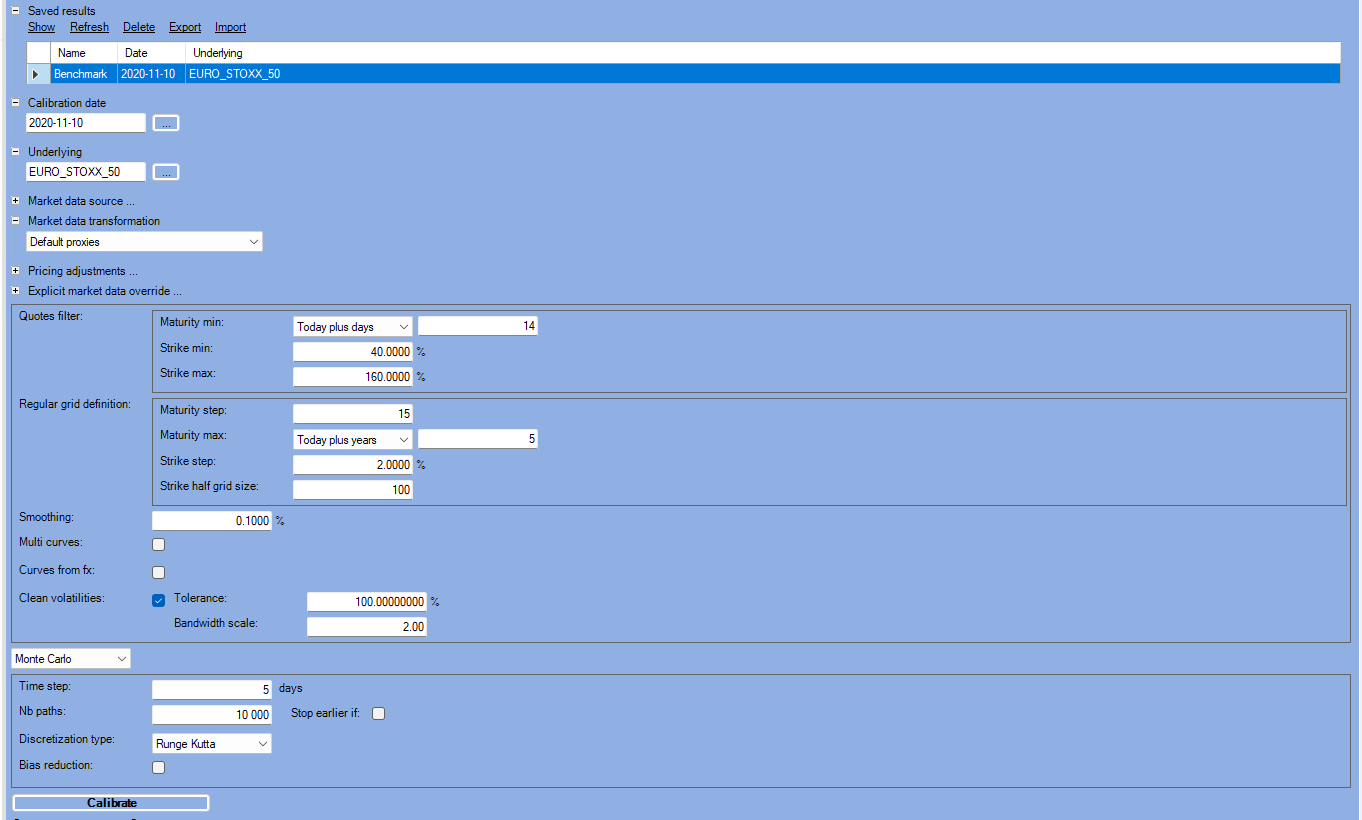 Figure 3: Calibration user interface for the Local Volatility model
Once the model is calibrated, results are available in both tabular form and as interactive graphical display (same for every models):
- The table in Figure 4 below allows inspecting the difference between quoted and calibrated data in basis points and percentages; Monte Carlo results are also displayed and compared to quoted market data. The regularized implied volatility column, which are market volatilities after interpolation, is displayed at last.
- In Figure 5 the Volatility surface can be inspected graphically in 3D, where users may select a given point in the graph to slice results in two charts: the implied volatility as a function of the strike or as a function of the maturity
- Regularized implied volatility
- Local Volatility
- As shown in Figure 6, for comparison and evaluation purposes, users can inspect a graph of a slice of the implied volatility at a user-defined maturity to trace market implied volatility next to the model implied volatility and the Monte Carlo’s implied volatility results
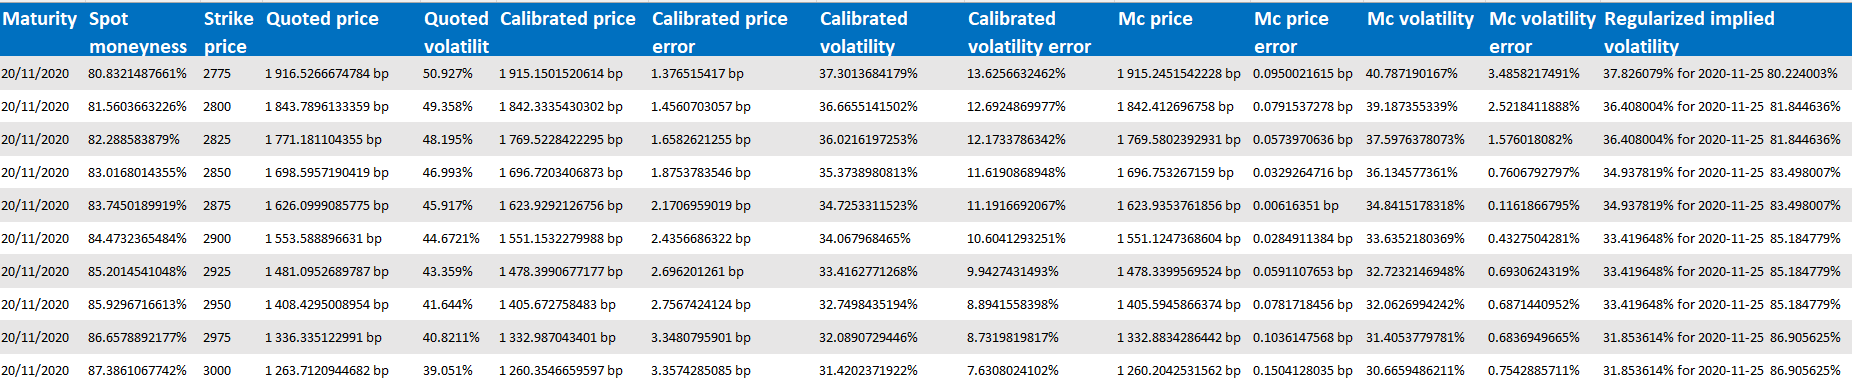 Figure 4 :table of Calibration results of the Local Volatility model in a tabular layout. Quoted market data vs. calibration results with the calculated error in basis points and percentage. Monte Carlo pricing results with associated calculated error in basis points and percentages followed by the Regularized implied volatility results calibration.
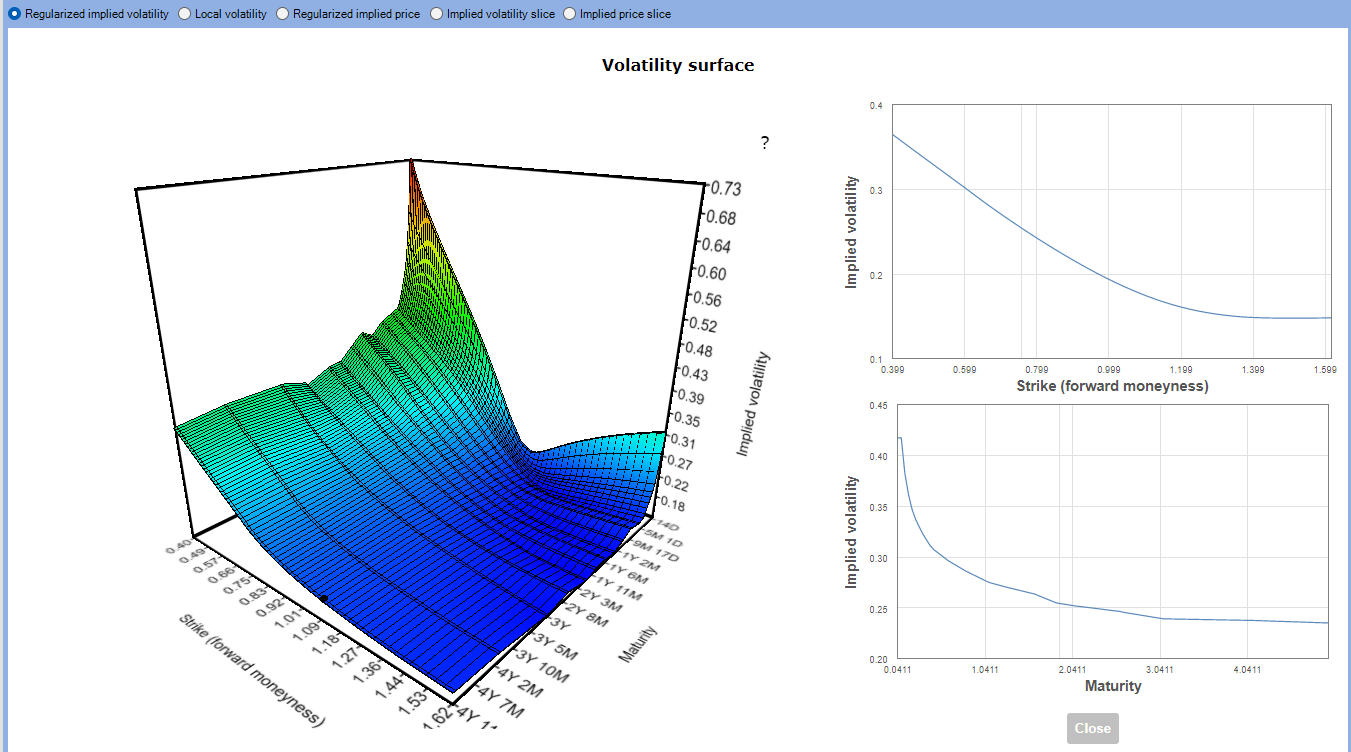 Figure 5: Volatility surface 3D chart
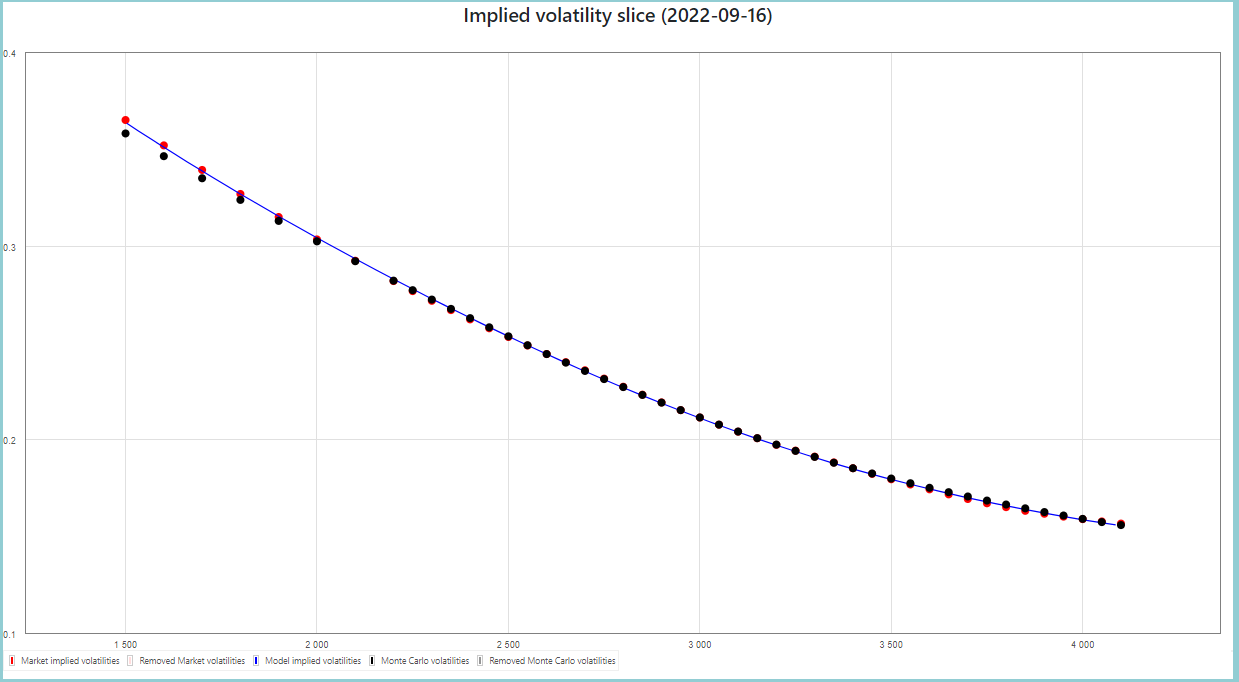 Figure 6: Implied volatility slice Chart